Financial Reporting
Back-Testing Fund Marks Against Exit Prices: A CFO's Method
A fund CFO's method for back-testing Level 3 marks against exit prices: what to compare, how to read the variance, and what auditors and the SEC expect to see.
By 409.AI Team - 2026-10-17
# Back-Testing Fund Marks Against Exit Prices: A CFO's Method
Your fund sold five portfolio positions this year. Every one of them carried a Level 3 mark in the quarter before the sale. Do you know how far those marks sat from what the buyers actually paid? If the answer is "roughly", your auditor, your valuation committee and your LPs will ask the same question you can't yet answer with a number.
This post is for the fund CFO, controller or valuation designee who signs off on quarter-end marks. It shows how to run a back-test of your own marks against your exits, how to read the result without fooling yourself, and what to keep in the file.
What a back-test is, and who asks for it
A back-test compares the fair value you carried for an investment against what you later got for it. The SEC defined the idea in the adopting release for Rule 2a-5: back-testing "involves a comparison of the fair value ascribed to the fund's investment against observed transactions or other market information," and one common form is "disposition analysis," which compares a fair value with the price obtained when the fund disposes of the holding. You can read it in the [Good Faith Determinations of Fair Value release](https://www.sec.gov/files/rules/final/2020/ic-34128.pdf).
Two limits matter before you build anything. Rule 2a-5 binds registered funds and business development companies, and a venture or private equity fund outside that world isn't subject to it. The release also says plainly that the final rule doesn't require back-testing, and that the method may be less useful for holdings that trade infrequently. The rule does require testing "the appropriateness and accuracy" of your methodologies, though, and the SEC calls calibration and back-testing particularly useful ways to do that. That's why [a private fund's valuation policy](https://www.409.ai/articles/sec-rule-2a-5-fair-value-process-private-fund-valuation-policy) usually borrows the language even when the rule doesn't apply.
The second audience is your auditor. An auditor testing an accounting estimate looks back at how the prior period's estimates turned out, and a fund's exits are the cleanest evidence available. If you've already done the comparison, the conversation in January is short. If you haven't, the auditor will do it on your behalf and you'll learn the result at the same time they do.
Build the comparison set
Start with a list of every disposition in the last two to three years: full exits, partial sales, secondary sales of your stake, write-offs and shutdowns. For each one, pull two numbers.
The last mark before the deal was knowable. Use the last quarter-end mark that preceded the point where a buyer, a price or a term sheet existed. If a letter of intent arrived in week three of the new quarter, the quarter-end mark that matters is the one before it. [How a fund treats information that arrives after the measurement date](https://www.409.ai/articles/january-round-december-31-mark-asc-855-subsequent-events-fund) is a separate ASC 855 question, and mixing it into the back-test hides the very bias you're looking for.
The proceeds, measured on the same footing. Count cash at close, plus the fair value of escrow and holdback amounts, plus the fair value of any earn-out, plus the value of stock received, all on the closing date. Cash at close alone understates a deal that holds back 15% in escrow and makes the mark look too high. If you carried the position at a probability-weighted value that included those pieces, compare it with the same pieces.
Include the failures. A back-test built only from successful exits is the most common way to produce a flattering result, because the positions that went to zero never "exit". A shutdown with no proceeds is a data point with a 100% negative variance, and it belongs in the set.
A worked example
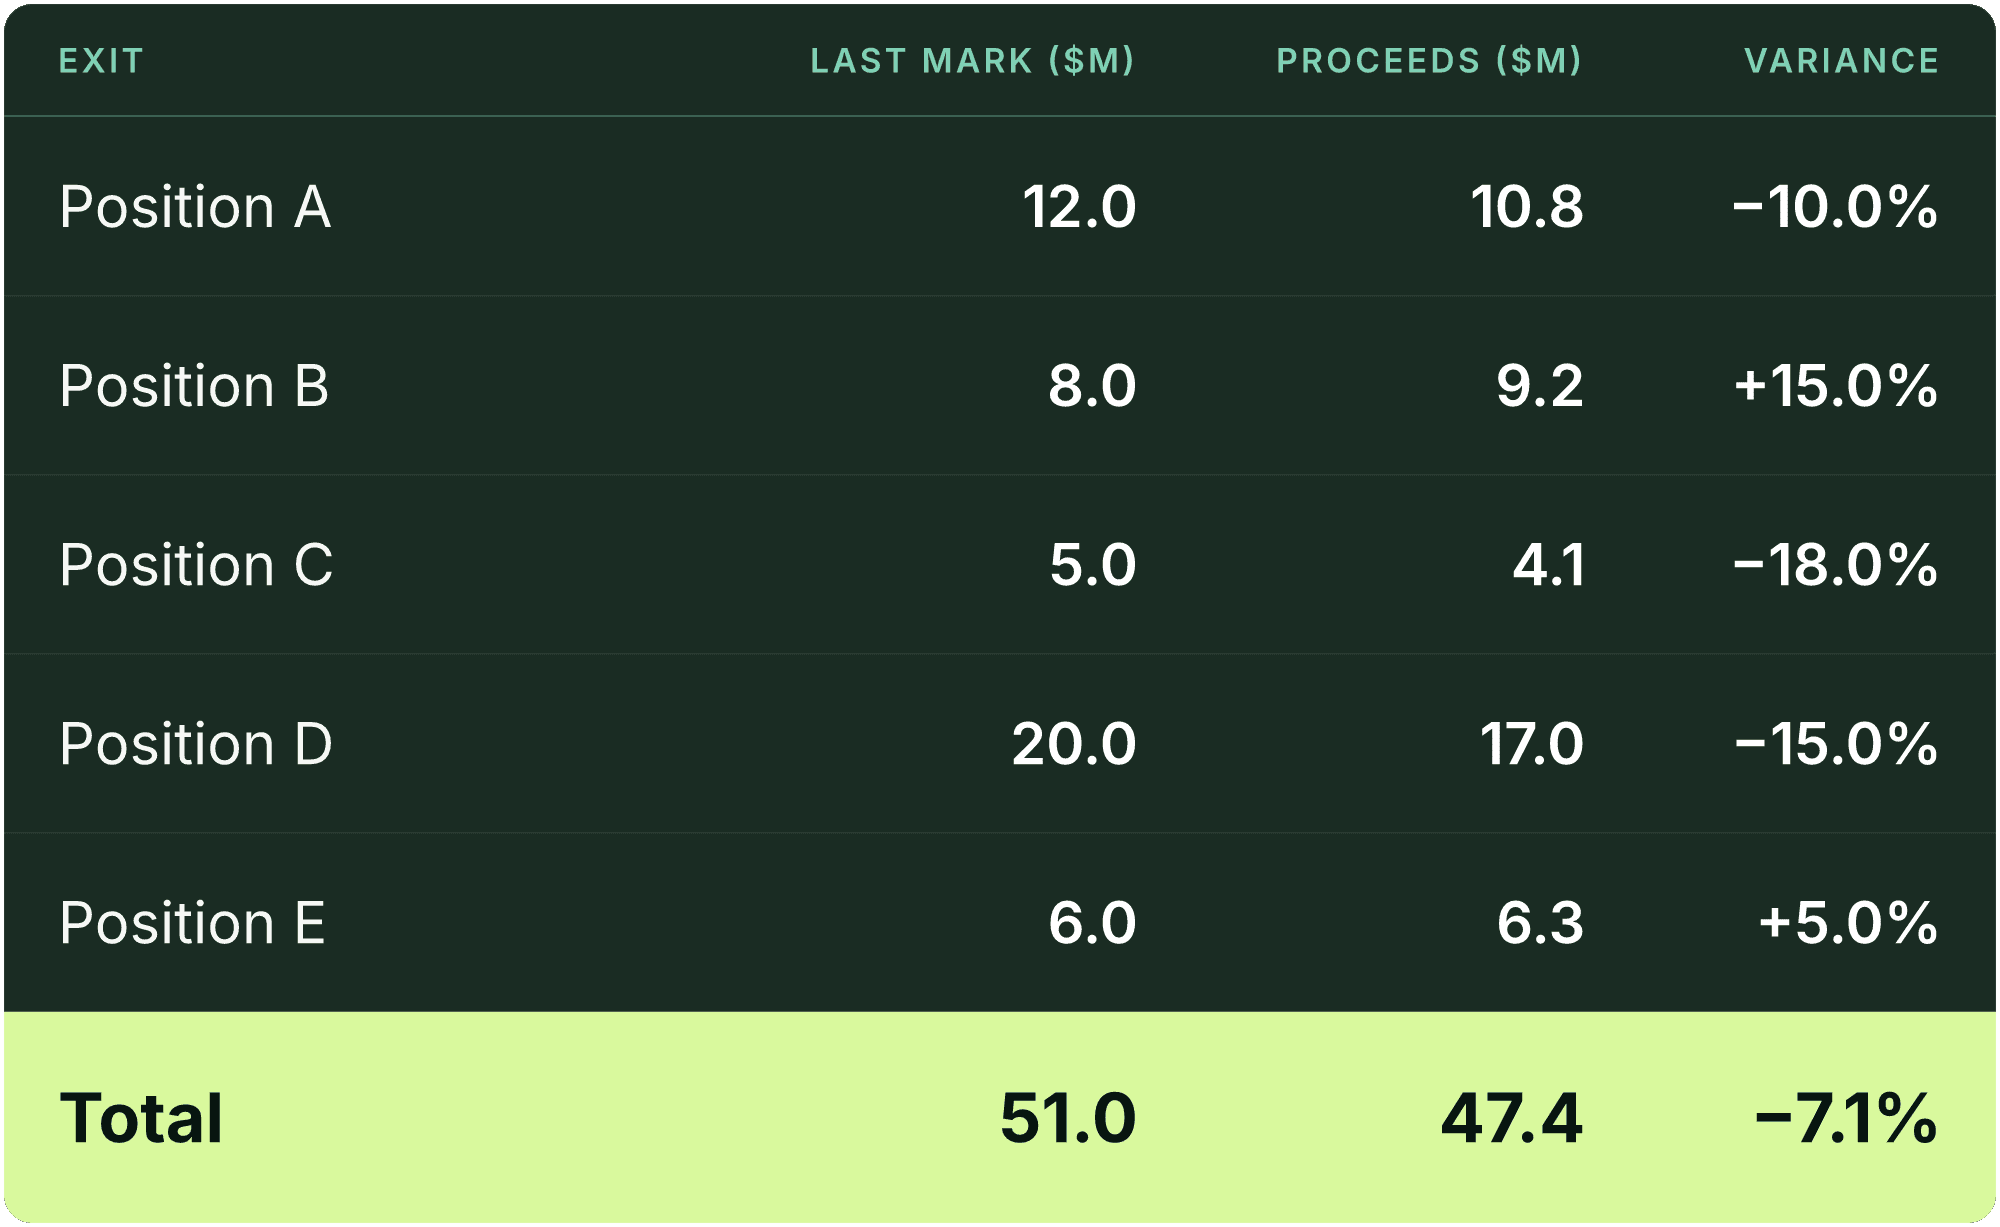
Take five exits. The last mark is what the fund carried one quarter before the deal became knowable. Proceeds are the closing-date fair value of everything received.
[](https://www.409.ai/uploads/back_testing_fund_marks_exit_prices_asc_820_disposition_analysis_table_1_7f9fc52a04.png)
The simple average of the five variances is -4.6%, and the median is -10.0%. The weighted figure is -7.1% because the biggest position, D, was also one of the worst misses. Three of the five exits came in below the mark, and the two that came in above it were small.
Which number should you quote? The weighted one, because dollars are what the NAV, the fees and the carry are built on. The simple average tells you about your process across positions, the weighted figure tells you about your balance sheet, and a gap between them tells you the large positions are where the process is weakest.
Reading the result
A single miss proves nothing. Marks are estimates, and a buyer can pay more or less than any model predicted. What you're looking for is direction and size.
Bias. If most variances point the same way, the method has a lean. Four of five exits below the mark, repeated over two years, says the fund is carrying positions too high, usually because it leans on a last round price, a public multiple that has since compressed, or a marketability discount that's too thin. Three of five above says the opposite. A balanced scatter around zero, with a median near zero, is what an unbiased method looks like.
Size. A -7% weighted variance means one thing in a fund whose marks typically move 2% a quarter and another in a fund whose marks move 15%. Compare the variance with the typical quarterly movement in your marks. If your back-test gap is larger than the quarter-over-quarter movements you report to LPs, those movements are mostly noise.
Concentration. Sort by dollar size, as in the example. If the large positions drive the miss, look there first: they get the most management attention and, often, the most generous assumptions.
Cause. The SEC release says that when fair values differ from observed transactions, the board or valuation designee "should investigate the reasons for this difference." Sort each miss into one of three buckets:
1. *Information that arrived later.* A customer was lost, a competitor raised, a buyer showed up with a strategic premium. This isn't a mark error. ASC 820 measures fair value on the measurement date, from the information market participants had then. Record it and exclude it from the bias tally, but note that you excluded it and why. 2. *An input you set too high or too low.* A discount for lack of marketability that vanished at exit, a scenario weight on an IPO that never came, a public comparable group that didn't resemble the company. This is the finding you can act on. 3. *A method problem.* You were carrying a position at the last round price long after the facts moved. [Calibration to the entry price](https://www.409.ai/articles/first-quarter-end-mark-unrealized-loss-transaction-costs-asc-820-asc-946) and a periodic reassessment against market evidence are the controls that catch this, and the SEC staff's September 2026 statement on private assets stresses [the same reassessment](https://www.409.ai/articles/sec-staff-statement-private-asset-fair-value-calibration-nav).
What to do with it
If the back-test shows a lean, change one thing and say so in the file. Typical fixes are a larger marketability discount on positions with no near-term liquidity, a revised scenario weighting for exit routes, or a shorter time before a last round price is treated as stale. Resist rewriting the whole method on five data points. A sample this small supports a hypothesis, which you test on the next several exits.
Document three things per quarter or per year, whichever matches your cycle: the comparison table, the bucketed explanation of each miss, and the decision the valuation committee took. Minutes that say "reviewed, no action" are fine when the result is clean. Minutes that say "reviewed, no action" after four misses in one direction aren't.
The back-test also connects to something fund CFOs feel directly. Carried interest accrued at quarter-end is computed from your marks, which means a mark that runs high accrues carry that may later reverse. Read [how the hypothetical liquidation method uses your marks](https://www.409.ai/articles/carried-interest-accrual-hypothetical-liquidation-fund-marks) alongside your back-test and you'll see what a persistent upward lean costs in clawback exposure.
Limits to state up front
Be honest about what a small fund can conclude. With five or ten exits, one large outlier moves the weighted result by several points. Pool partial sales, follow-on rounds that priced your existing stake, and secondary transactions in the same name as additional observations, and flag which are which. A secondary sold at a discount to NAV is a different kind of evidence than a control sale, and the two shouldn't be averaged without a label.
Say, too, that the exercise tests your method and not your investment skill. A fund can have a clean back-test and weak returns. The reverse also happens. The goal is a mark that, on average, is where a buyer would later agree it was.
The takeaway
Before the year-end audit starts, build the five-column table above for every disposition since January of last year, bucket every miss, and put the weighted variance next to the largest position's name. If that one line is negative and the biggest holding is the cause, you've found the conversation to have with your valuation committee before your auditor has it for you. For the wider file an auditor expects behind each mark, see [what a fund's valuation policy needs to survive an audit or exam](https://www.409.ai/articles/fund-valuation-policy-asc-820-audit-sec-exam), and the [ASC 820 valuation service](https://www.409.ai/products/asc-820) if you want an independent party to run the comparison.