Education
How 409A Valuations Differ by Industry: Volatility, Exit Timing and the Discount
For late-stage CFOs: how industry enters a 409A through volatility, exit timing and the DLOM, with January 2026 sector data and a worked backsolve example.
By 409.AI Team - 2026-11-19
# How 409A Valuations Differ by Industry: Volatility, Exit Timing and the Discount
If you're the CFO of a Series C or later company, you've probably compared notes with a peer at another startup and found that their common stock sits at a very different share of their preferred price than yours does. A software company and a biotech company can close rounds at the same price per share and still come out of their 409A refreshes with different strike prices. Some of that is the cap table. A lot of it is the industry.
The 409A regulations never mention industries by name. What they do require is that the valuation consider "the market value of stock or equity interests in similar corporations and other entities engaged in trades or businesses substantially similar" to yours, along with discounts for lack of marketability ([Treas. Reg. §1.409A-1(b)(5)(iv)(B)](https://www.law.cornell.edu/cfr/text/26/1.409A-1)). That one clause is how your sector gets into the number. At the late stage it shows up in three inputs: volatility, the expected time to exit, and the marketability discount. They don't all push the same way, which is why the outcome surprises people.
Volatility: the input that changes most from sector to sector
Most late-stage 409As allocate equity value with an option pricing model (OPM), a backsolve to the latest round, or a hybrid that adds exit scenarios on top. If you want a refresher on how those methods split value between classes, our guide to [OPM, PWERM and the backsolve](https://www.409.ai/articles/409a-allocation-methods-opm-pwerm-backsolve) covers it. Every OPM needs a volatility assumption, and a private company has no trading history to measure one. So the valuation borrows it from guideline public companies in the same line of business, adjusted for size and stage.
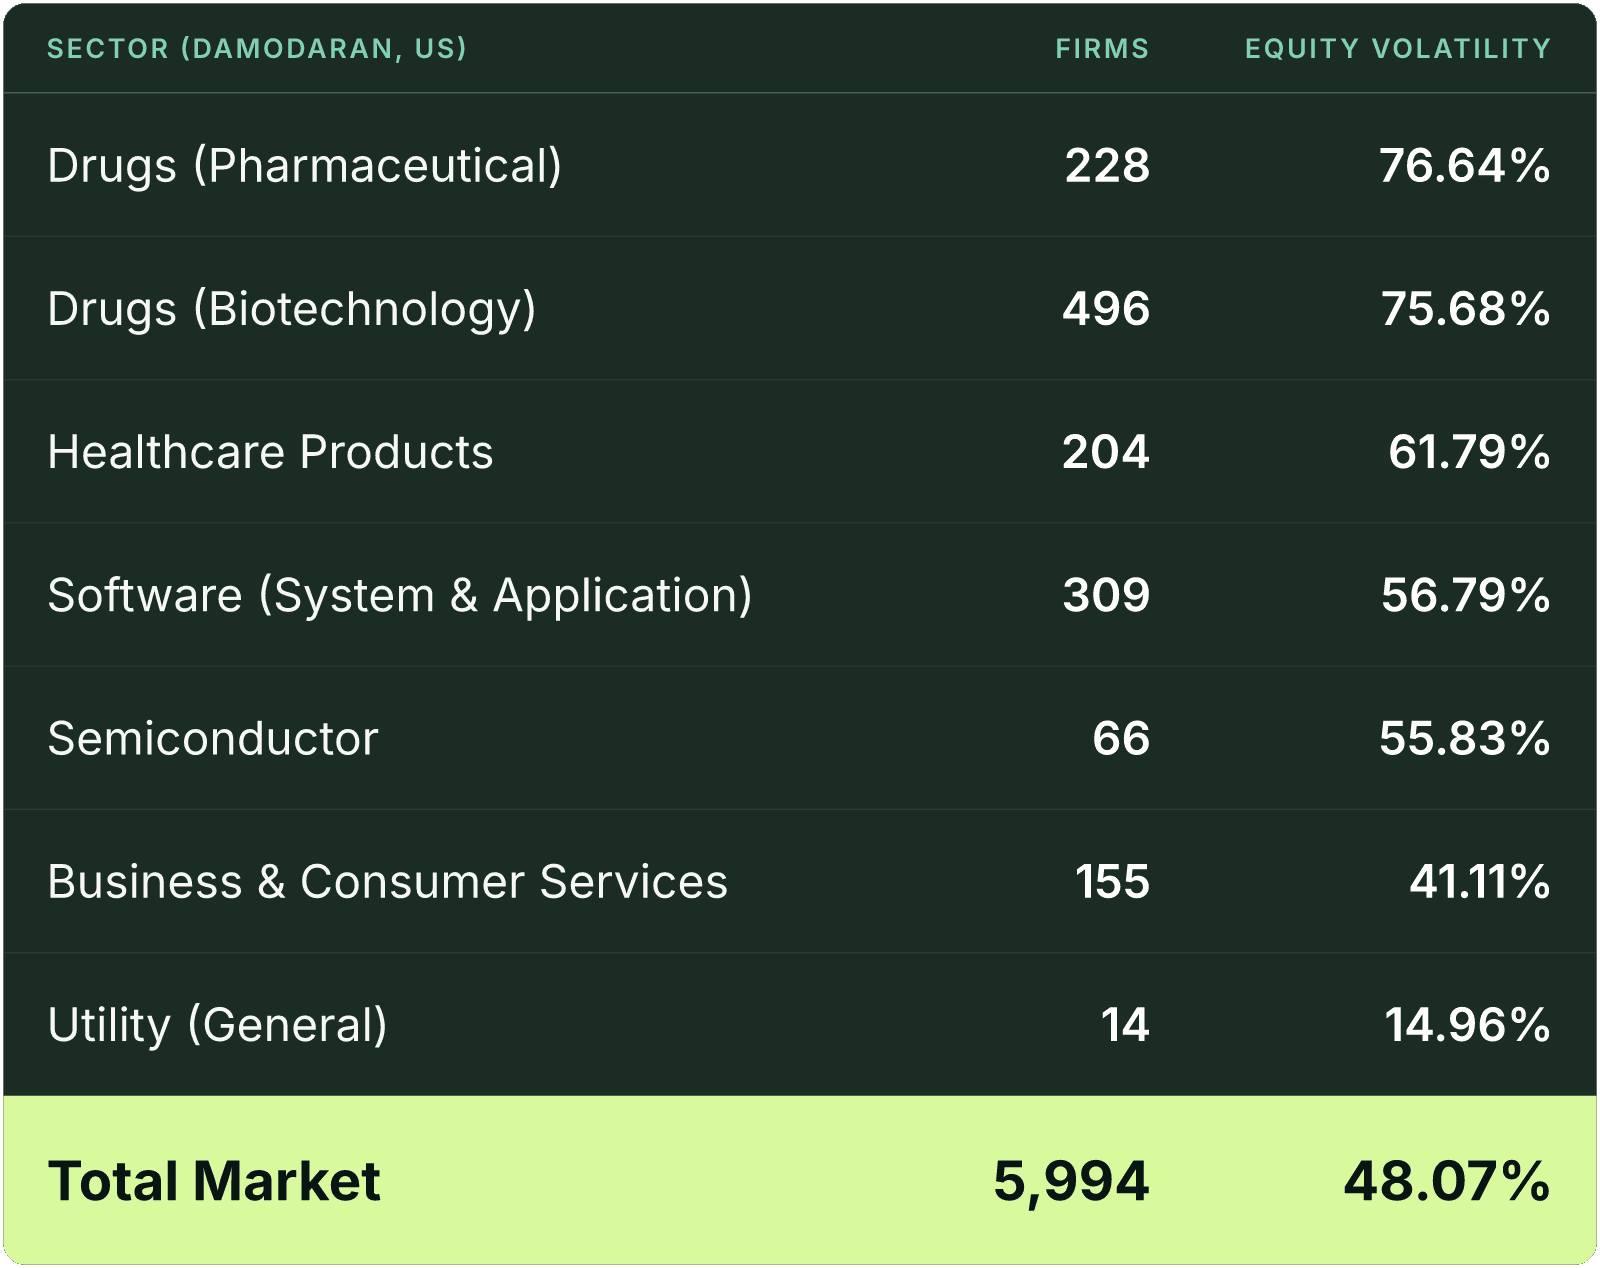
Public market volatility differs a lot by sector. Aswath Damodaran's dataset of US equity standard deviations, with data as of January 2026, shows the spread clearly ([NYU Stern, Standard Deviations by Sector](https://pages.stern.nyu.edu/~adamodar/New_Home_Page/datafile/optvar.html)):
[](https://www.409.ai/uploads/409a_valuation_by_industry_late_stage_volatility_exit_timing_dlom_table_1_7ef8c844c0.png)
Treat these as reference points, not inputs to copy. A sector average mixes mega-caps with small caps, and a pre-IPO company is usually more volatile than the large public names in its sector. A careful appraiser picks a peer set that looks like your business, measures volatility over a period that matches the expected time to exit, and explains the choice. Our piece on [Black-Scholes inputs for private companies](https://www.409.ai/articles/black-scholes-inputs-private-company-stock-options) walks through how that selection works. Still, the table tells you roughly where you'll land: a clinical-stage biotech starts from a volatility around 20 points higher than an enterprise software company.
Exit timing: the industry sets the clock
The second input is the term: how long the model assumes until a liquidity event. Industry drives this too. A software company with steady recurring revenue and a bank already talking about an IPO might model one to two years. A biotech whose exit depends on a Phase 2 readout might model longer, or swap the single term for weighted scenarios tied to the trial outcome. A hardware company that still needs another capital-intensive round sits somewhere in between.
When a specific outcome is in view, many late-stage valuations stop relying on the OPM alone and weight discrete exit scenarios. That's the [hybrid method](https://www.409.ai/articles/hybrid-method-409a-pwerm-opm-exit-probability-signed-loi), and the scenarios themselves look different by industry: an approval-driven acquisition for a drug developer, an IPO or strategic sale for a software business.
The marketability discount: same math, different inputs
The third input is the discount for lack of marketability (DLOM). Common stockholders can't sell their shares, so the value per share before the discount gets cut to reflect that. At the late stage, the discount is often estimated with a put option model: what would it cost to insure the share price for the time until liquidity? John Chaffe proposed the protective put in 1993, and John Finnerty's average-strike put model (Journal of Derivatives, 2012) is a common alternative that produces lower figures. Both rise with volatility and with time. We cover the mechanics in our article on [the DLOM in a 409A](https://www.409.ai/articles/discount-lack-marketability-dlom-409a-valuation).
This is where the industry effect turns back on itself. Higher volatility makes the common stock's option-like claim worth more before the discount. It also makes the discount bigger.
A worked example: one round, four sectors
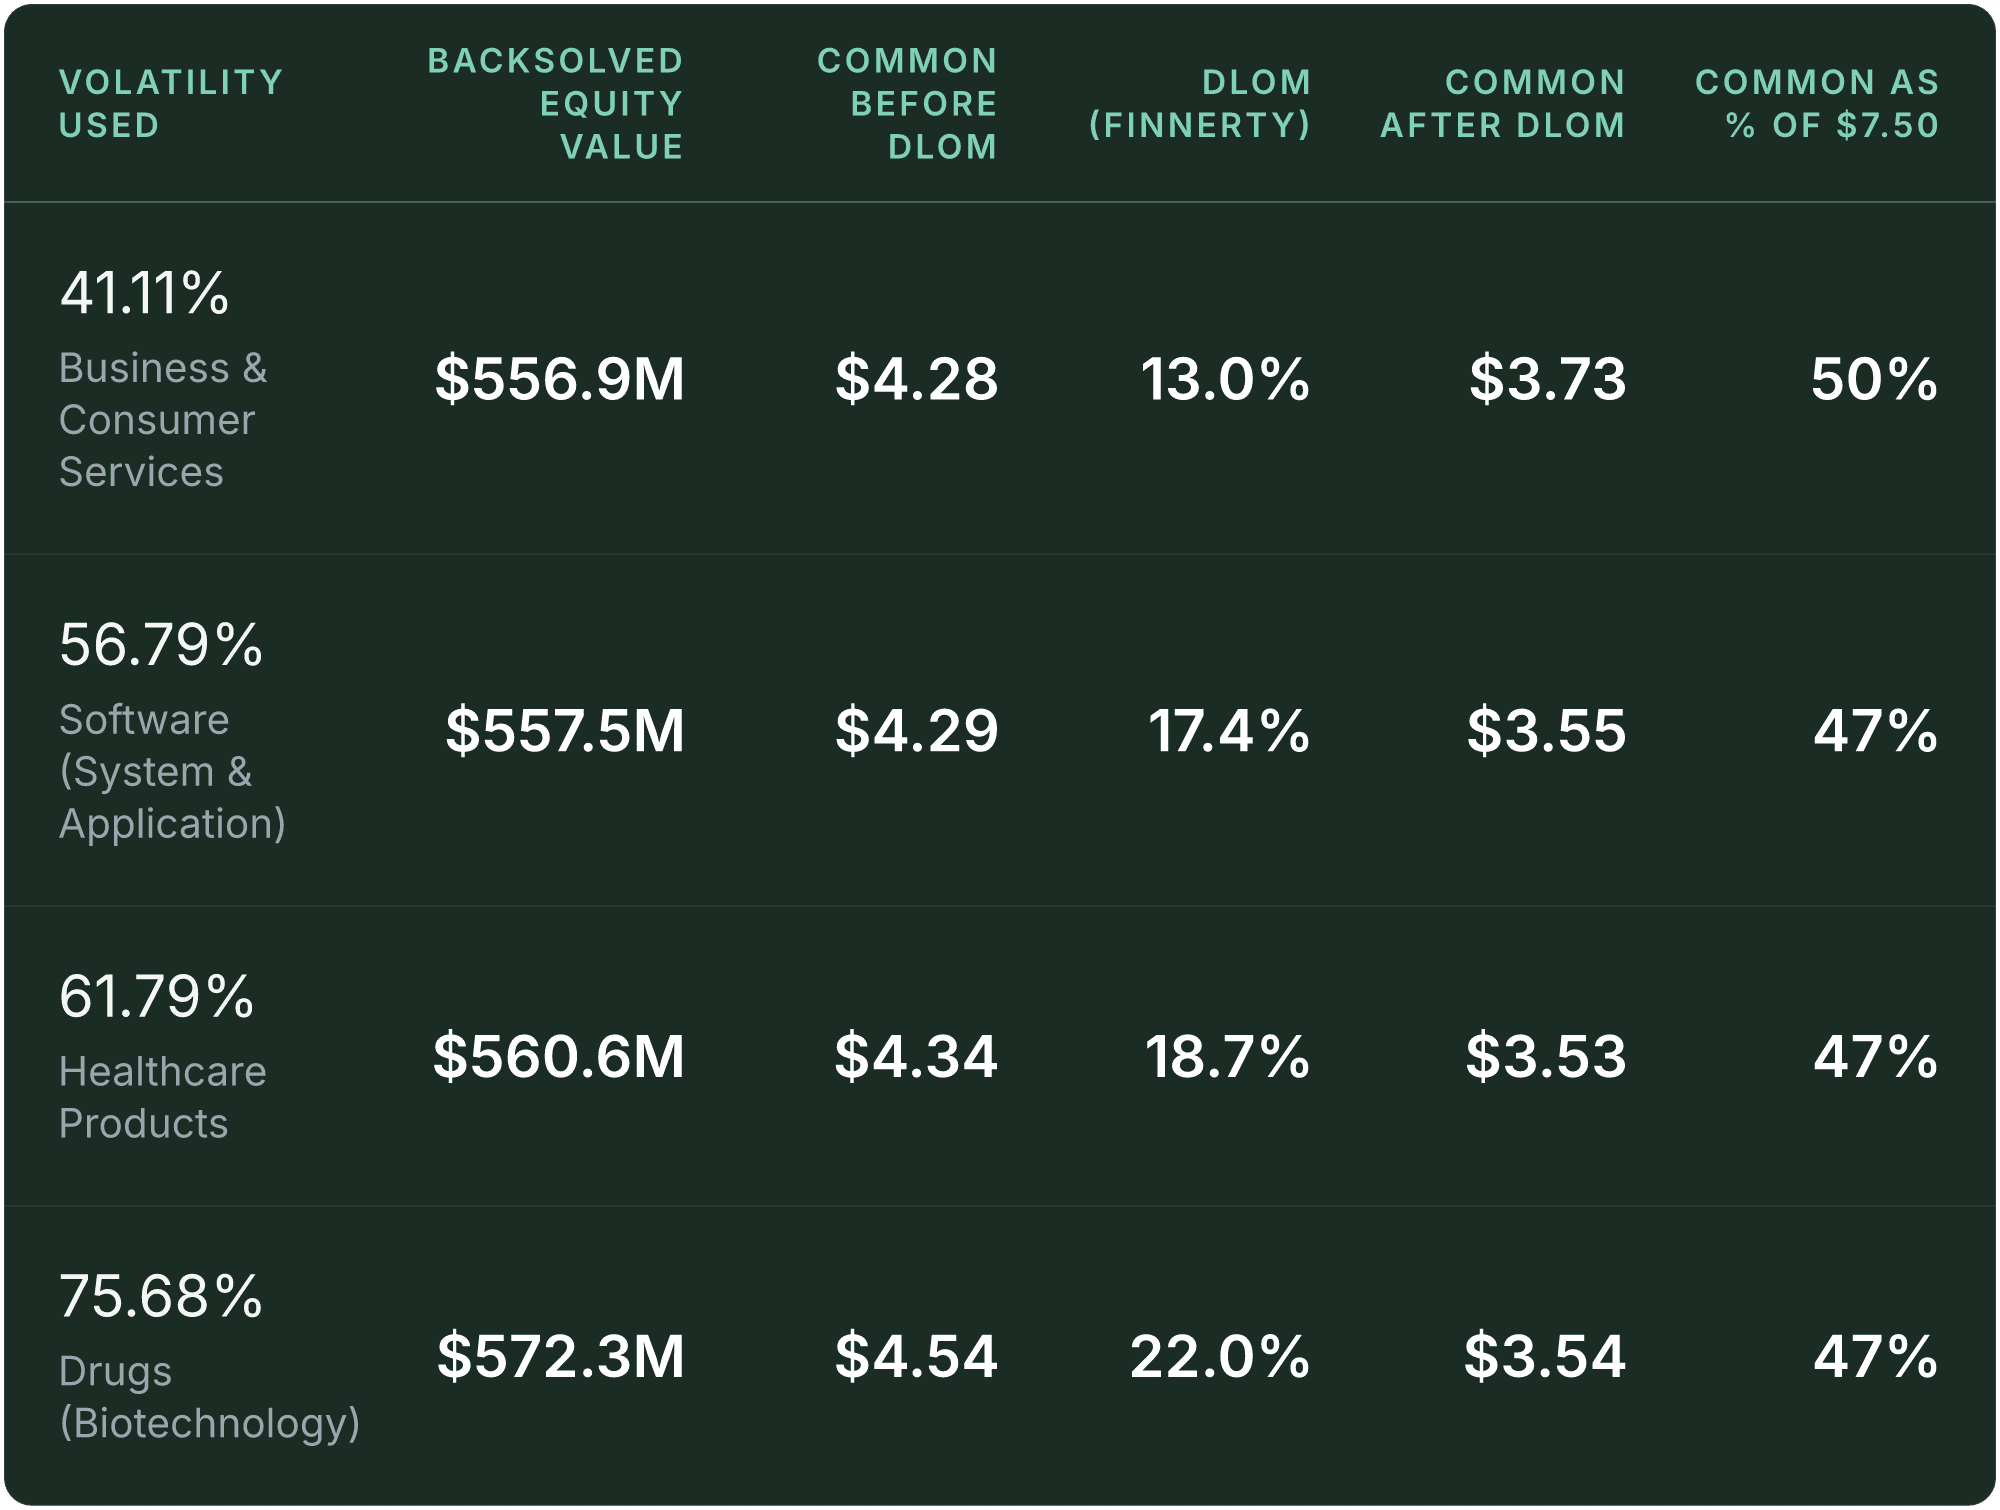
Here's an illustrative company. It has 60 million common shares and 40 million preferred shares. The preferred investors paid $7.50 a share, $300 million in total, with a 1x non-participating preference. We backsolve the total equity value so the OPM prices the preferred at exactly $7.50, assume a two-year term and a 3.5% risk-free rate, and then apply a Finnerty DLOM. The only thing that changes from row to row is the volatility, set at each sector's Damodaran figure.
[](https://www.409.ai/uploads/409a_valuation_by_industry_late_stage_volatility_exit_timing_dlom_table_2_5b3b778c71.png)
Read across the biotech row. The higher volatility lifts the common's value before the discount from $4.28 to $4.54, because the model gives more weight to outcomes where the company is worth far more than the preference. Then the discount climbs from 13.0% to 22.0% and takes most of that gain back. Between the calmest and the most volatile sector, the strike price moves by $0.19 a share, from $3.73 to $3.54.
So volatility on its own explains less of the industry gap than most CFOs expect. When your peer's common-to-preferred ratio differs from yours by 20 points, the cause is rarely the volatility input alone.
Where the bigger gaps come from
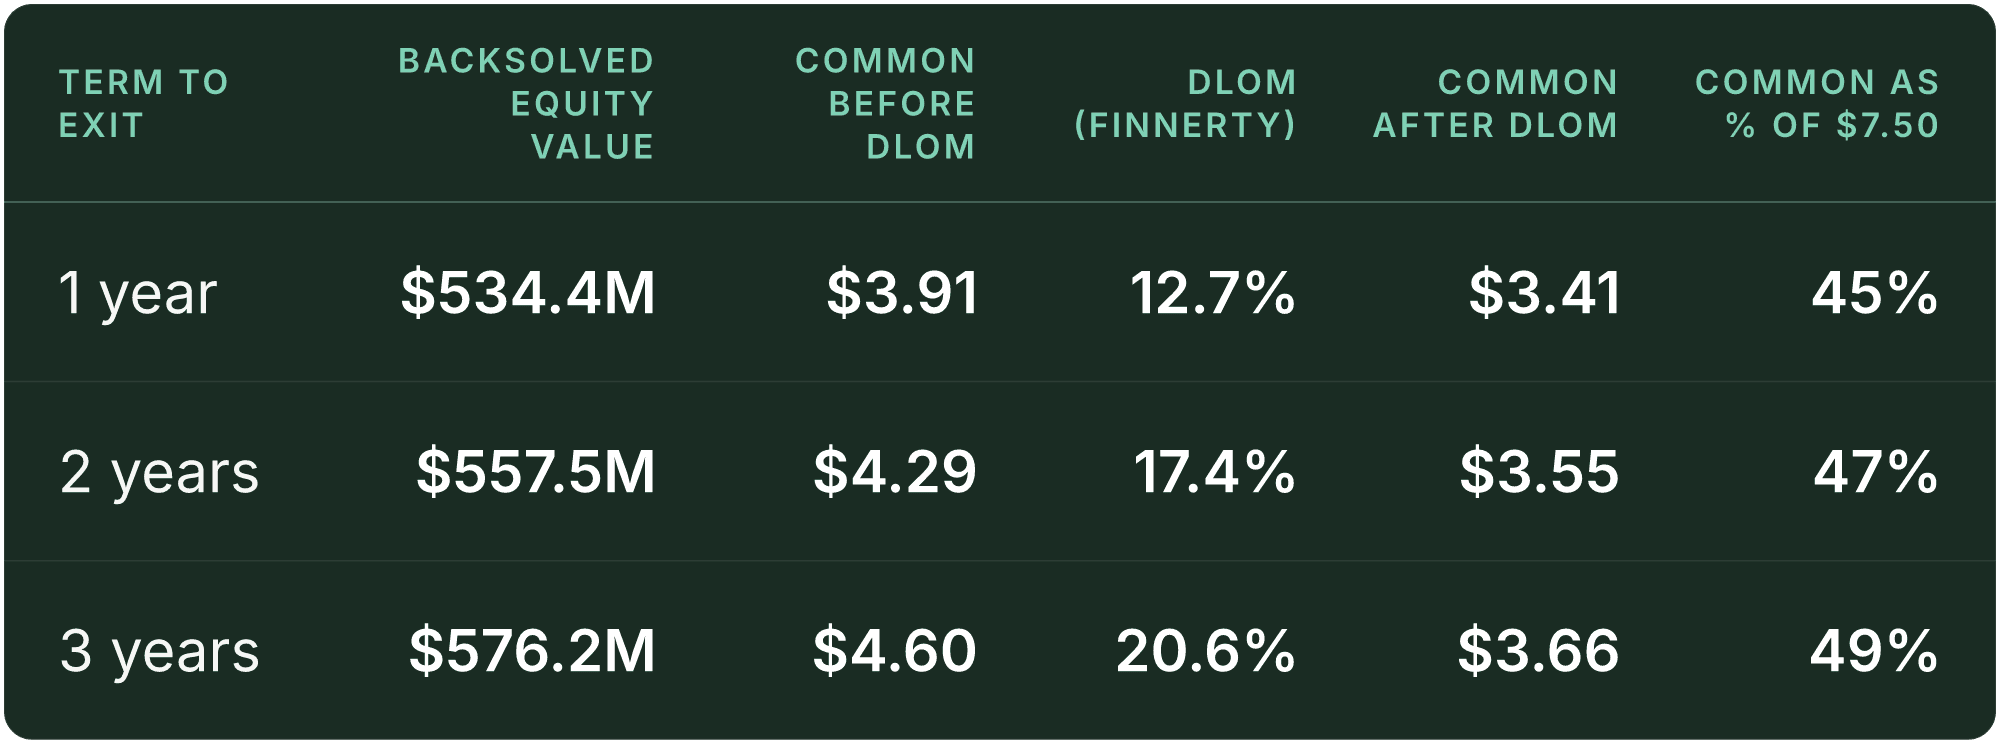
Time to exit moves the result about as much as volatility does, and in the other direction. Keep the software volatility at 56.79% and change only the term:
[](https://www.409.ai/uploads/409a_valuation_by_industry_late_stage_volatility_exit_timing_dlom_table_3_1a024509ba.png)
Here a longer term raises the common price, even after a larger discount, because in a backsolve the longer horizon gives the junior class more time to finish in the money. That's specific to this capital structure. A company with stacked preferences, participation rights or a large senior series can see the opposite.
The largest industry differences tend to come from the rest of the analysis:
- **The capital structure.** Biotech and hardware companies often raise more preferred capital before revenue, so the preference stack is deeper and the common sits further down the [liquidation waterfall](https://www.409.ai/articles/liquidation-preferences-waterfall-common-stock-exit).
- **Scenario weights.** A binary event like a trial readout puts large probability on outcomes where common receives little or everything. A hybrid method captures that; a single OPM doesn't.
- **Which approach carries weight.** A software company with predictable revenue may lean on revenue multiples from public peers. A pre-revenue drug developer can't, so the backsolve or a scenario analysis carries more of the conclusion.
What to do with this before your refresh
Ask your appraiser three questions when the draft comes back. Which guideline companies set the volatility, and why do they fit your business rather than your sector's average? What term did they use, and does it match what your board actually expects for an exit? Which DLOM model did they use, and what inputs drove it?
If those answers line up with your plans, a gap between your ratio and a peer's in another industry isn't a red flag. It's the regulation's "similar corporations" clause doing its job. If the term assumes a two-year exit while your board is preparing an S-1 for next spring, that's worth raising before you grant at the new price.
The common-to-preferred ratio you hear from a peer in another sector is a poor benchmark for your own. Compare your inputs to your own exit plan instead: the volatility to your peer set, the term to your board's timetable, and the discount to both. If you're preparing a late-stage refresh, our [409A valuation](https://www.409.ai/products/409a) starts at $899 and shows every one of those inputs in the report.