Equity
What 619 Published 409A Valuations Show About the Marketability Discount
For founders reading a 409A draft: what 619 409A valuations published from April 2024 to September 2026 show about the marketability discount by stage.
By 409.AI Team - 2026-10-22
# What 619 Published 409A Valuations Show About the Marketability Discount
Every 409A report carries one line that moves the strike price more than any other: the discount for lack of marketability, or DLOM. A founder reading the draft usually meets it as a single percentage with a page of methodology behind it, and the first question is always the same. Is that number normal? We looked at every 409A valuation 409.AI published from its first report in April 2024 through September 30, 2026, 619 reports in all, and let the data answer. This is the first in a series of 409.AI Data stories drawn from our own valuations, in aggregate and with nothing that identifies a company.
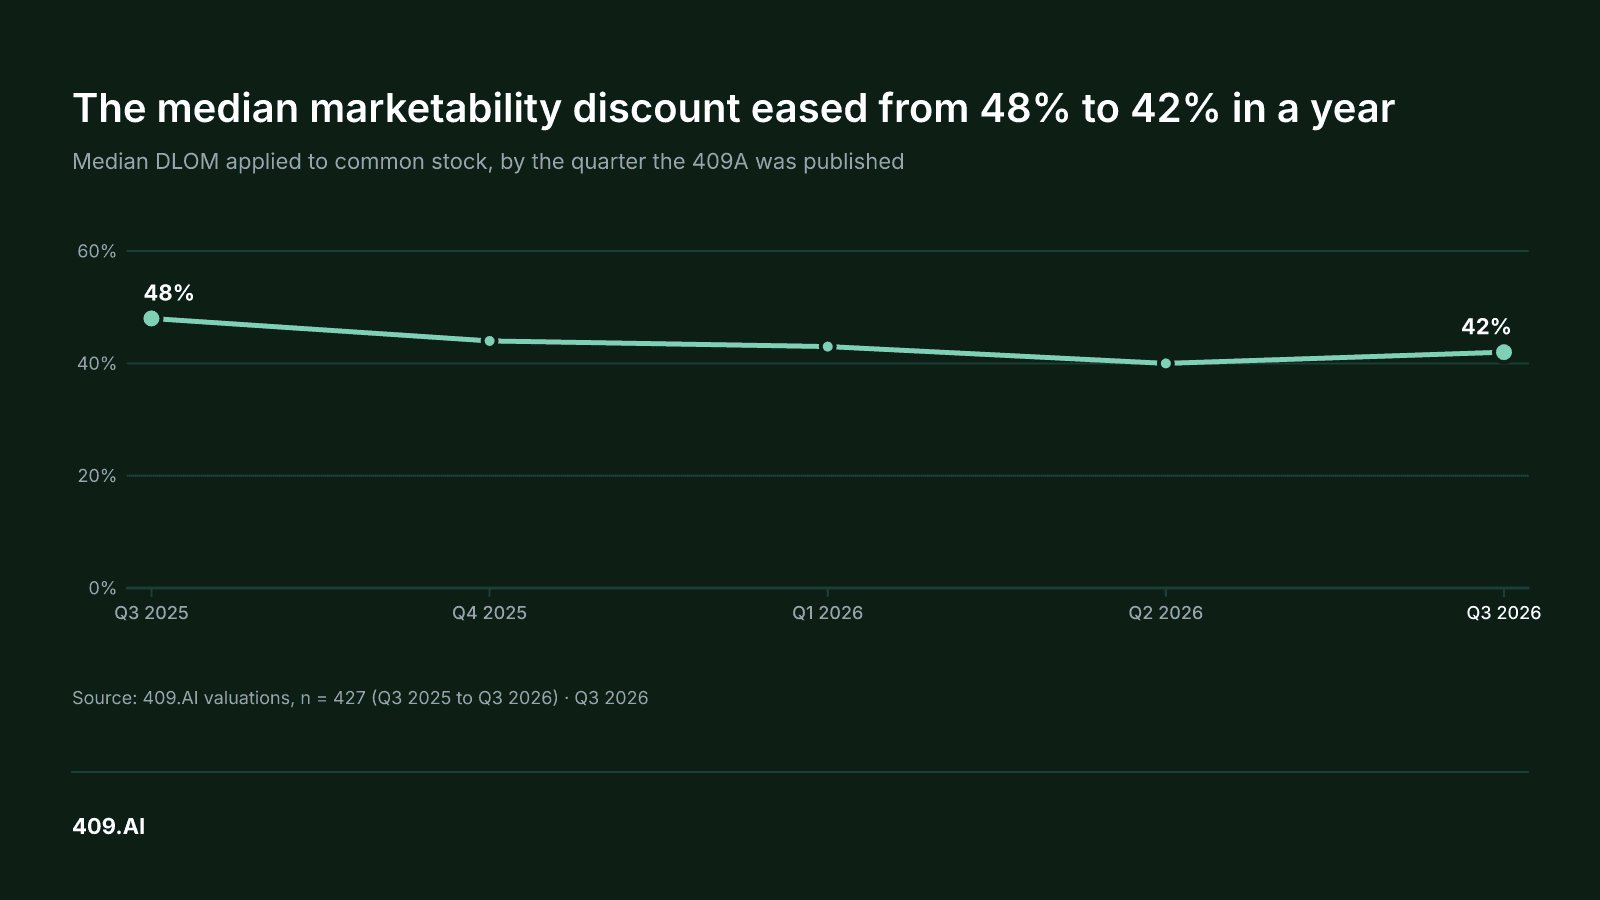
The short version: in the third quarter of 2026 the median discount applied to common stock was 42%, down from 48% a year earlier. It is not the same at every stage of a company's life, and the stage where it peaks is not the one most founders would guess.
The median discount has eased over the past year
[](https://www.409.ai/uploads/409a_dlom_by_stage_and_quarter_409ai_data_q3_2026_chart_1_0a3d5cbd55.png)
The discount is the last step in a 409A. The valuation first arrives at a value for the company, allocates it across preferred and common stock, and then asks what a buyer would pay for common shares that cannot be sold on any exchange. The DLOM is the haircut that answers the question. In [the DLOM explainer](https://www.409.ai/articles/discount-lack-marketability-dlom-409a-valuation) we walk through how it is built; here the point is simply where it has landed.
Across the five quarters the series covers, each with at least 30 valuations, the median moved from 48% in the third quarter of 2025 to 44%, 43%, 40% and then 42% in the third quarter of 2026. That is a six-point decline over a year, with a small rebound in the latest quarter. The valuations in the latest quarter number 133, the largest group in the series, so the 42% is the best-supported figure on the chart.
What the chart does not show is a single company. Each point is the midpoint of dozens of valuations, with half the reports above it and half below. A 42% median means a founder who sees 38% or 46% in a draft is well inside the ordinary range, not an outlier.
The discount peaks after the first revenue, not before it
[](https://www.409.ai/uploads/409a_dlom_by_stage_and_quarter_409ai_data_q3_2026_chart_2_ad1192dbb0.png)
Each 409A report places the company on one of the six AICPA stages of enterprise development, from a stage 1 company with an idea, a tentative plan and no revenue, to a stage 6 company with an established history of profitable operations. The intuition most founders carry is that the earlier the company, the bigger the discount, because the shares are further from any exit.
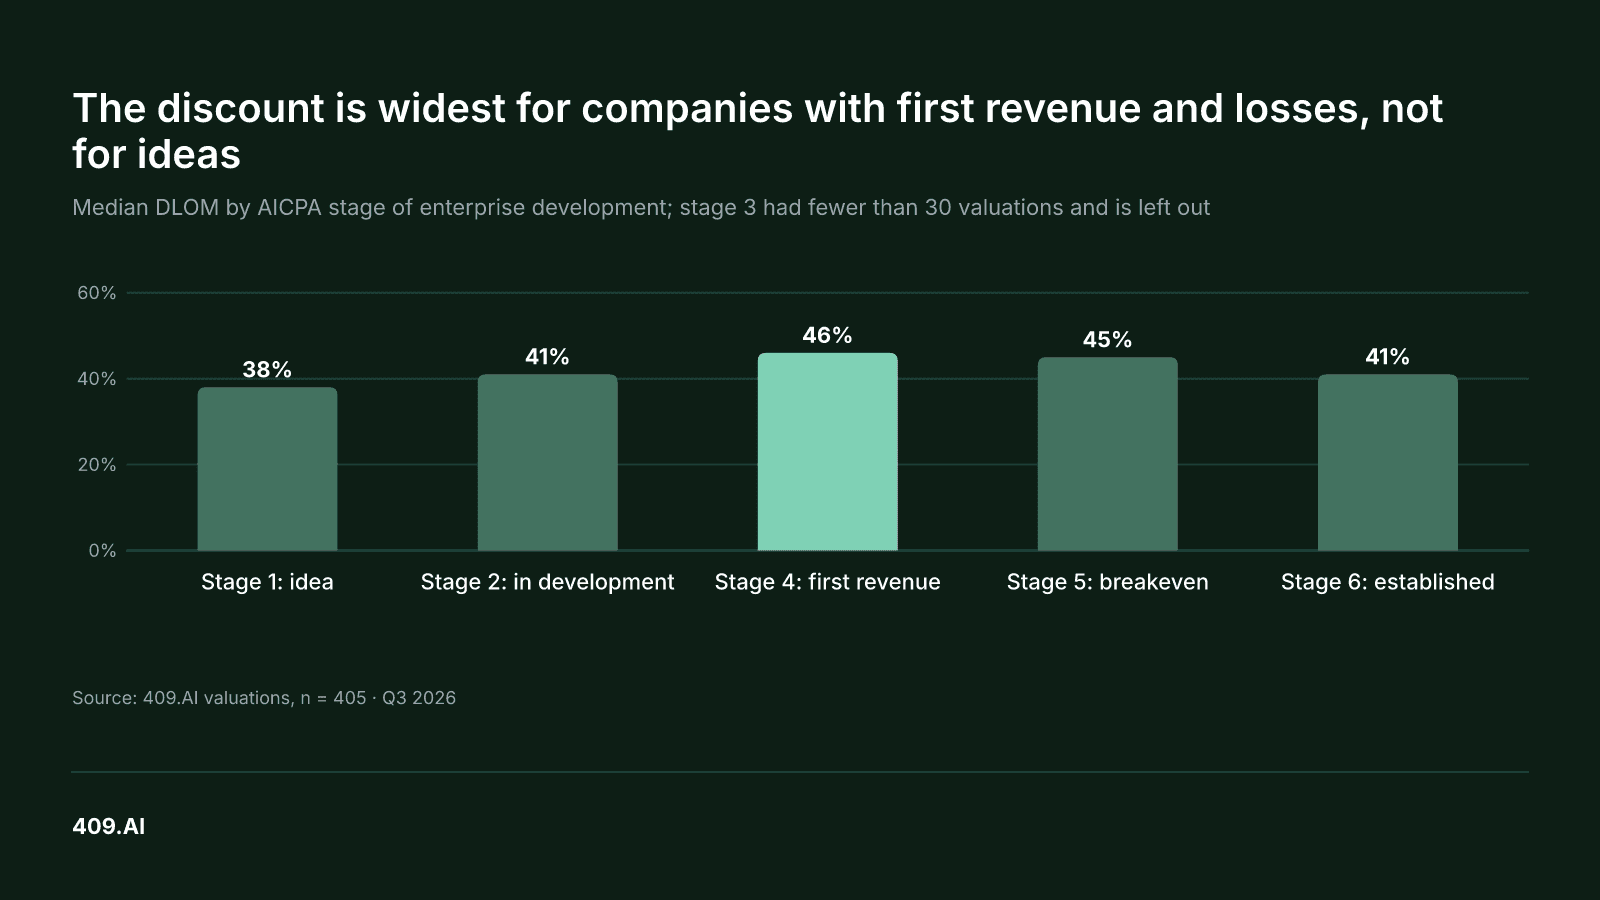
The data says otherwise. Stage 1 companies, the earliest, carry the smallest median discount at 38%. Stage 2 companies, with a product in development and still no revenue, sit at 41%. The peak comes at stage 4, companies with their first product revenue that are still operating at a loss, where the median discount is 46%. Stage 5 companies, which have reached breakeven or profitability, are close behind at 45%, and stage 6 companies fall back to 41%.
Stage 3, where development is near complete but revenue has not started, had 22 valuations in the period, under the 30 we require to show a figure, so it is left out rather than shown on thin evidence.
Why would a company with revenue carry a larger discount than one with only an idea? Part of the answer is in how the discount is built. The reports blend a qualitative analysis of the company with two option-pricing models, the Chaffee and Finnerty models, and both models are driven mainly by two inputs: the volatility of the equity and the time until the shares can be sold. A longer time to the modelled exit raises the discount in both models, and so does higher volatility; the qualitative analysis can move it either way. The next chart shows that volatility alone does not explain the pattern.
Volatility is high at every stage, and it is not the whole story
[](https://www.409.ai/uploads/409a_dlom_by_stage_and_quarter_409ai_data_q3_2026_chart_3_4cbbf32047.png)
Volatility is the input founders ask about least and that matters most to the option models. A private company has no trading history, so the report derives it from a set of guideline public companies: it blends their historical and implied equity volatilities, removes the effect of their debt, and then relevers the result for the subject company's own capital structure. Our walkthrough of [where private-company Black-Scholes inputs come from](https://www.409.ai/articles/black-scholes-inputs-private-company-stock-options) covers the mechanics.
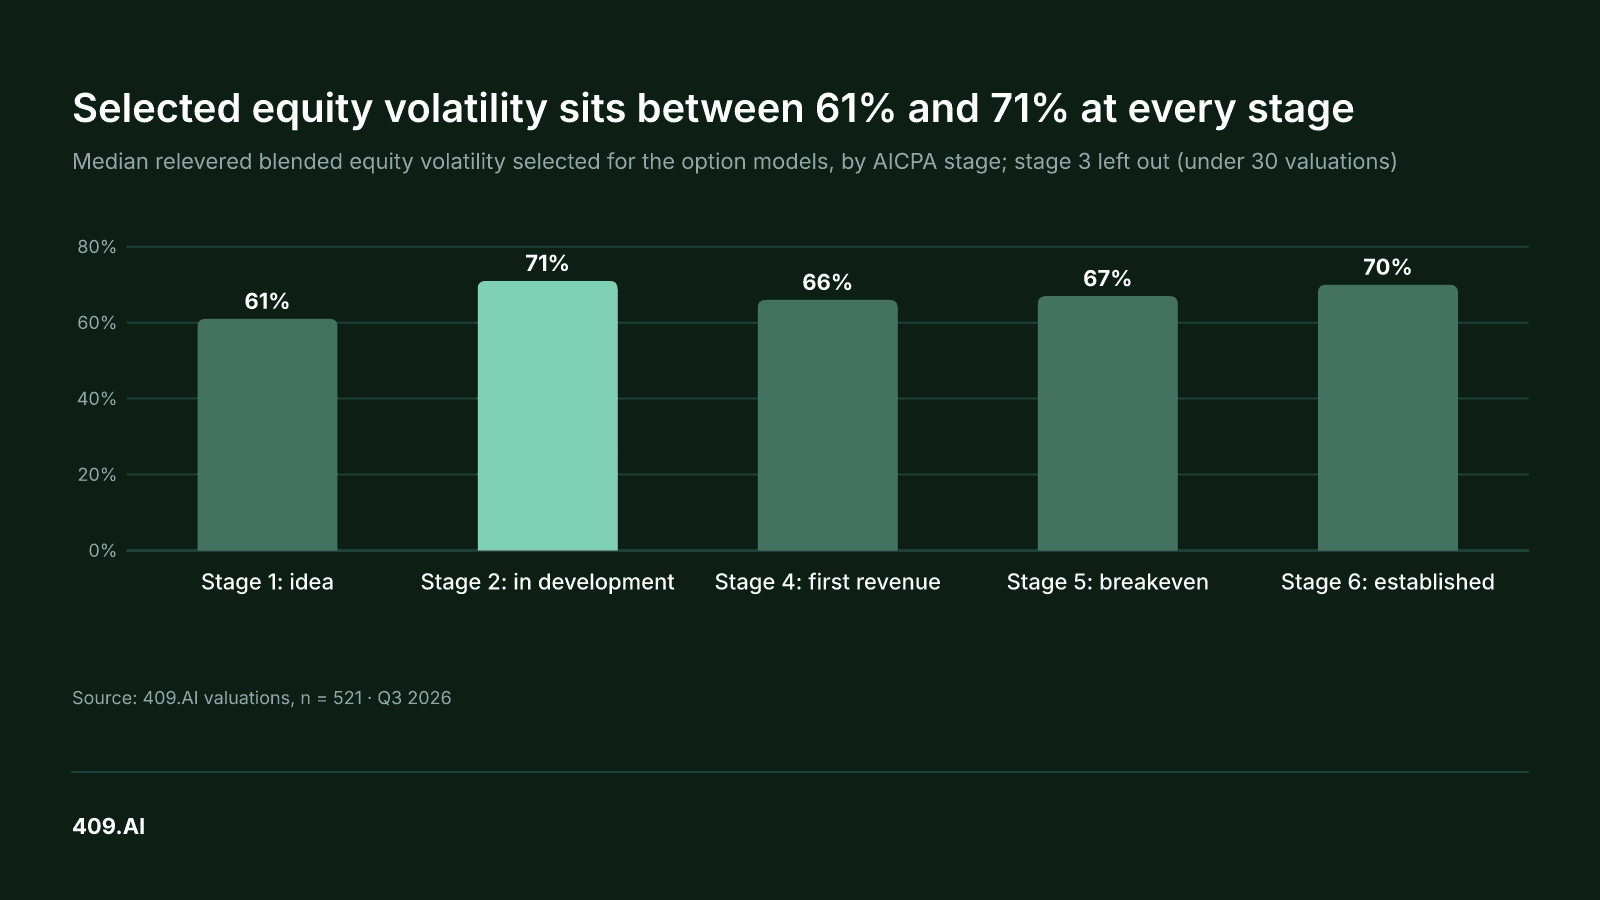
The median selected volatility runs from 61% for stage 1 companies to 71% for stage 2 companies, with stage 4 at 66%, stage 5 at 67% and stage 6 at 70%. That is a ten-point spread, and it does not line up with the discount. Stage 2 companies carry the highest volatility and a middling 41% discount; stage 4 companies carry a lower 66% volatility and the highest 46% discount.
The lesson for a founder reading a draft is to look past the volatility line. The time to a liquidity event and the weights across the qualitative analysis and the two models move the discount too, and the chart above shows that volatility is not what sorts the stages. All three inputs sit in the DLOM section of the report, and all three are worth a question before the draft is accepted.
Which approaches the valuations actually used
[](https://www.409.ai/uploads/409a_dlom_by_stage_and_quarter_409ai_data_q3_2026_chart_4_1b00bf1e89.png)
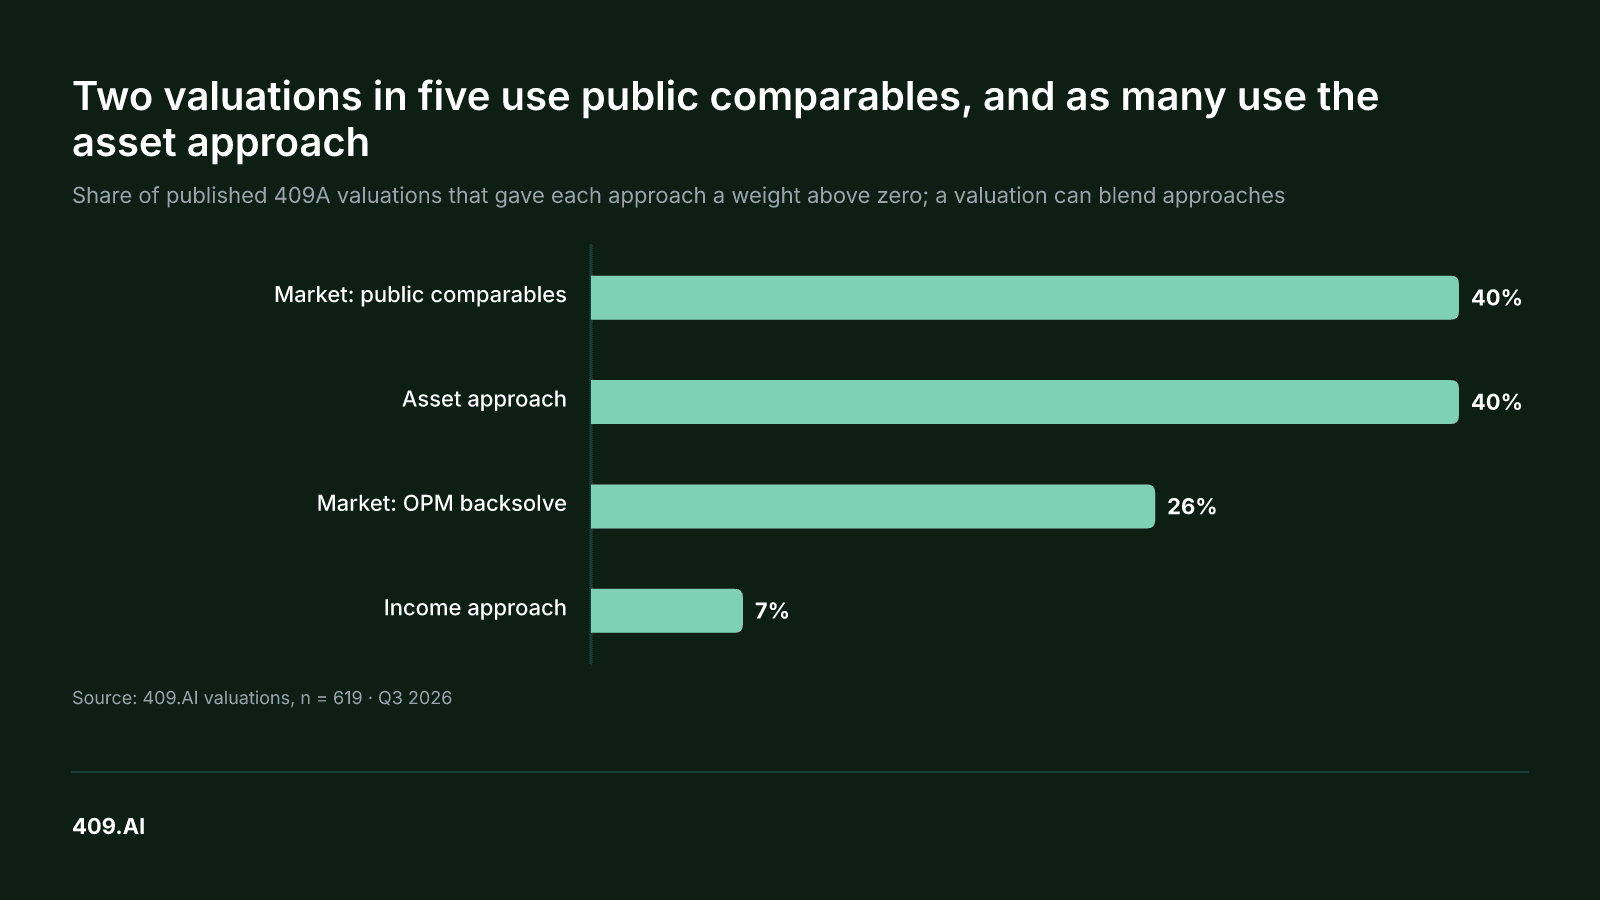
The discount is applied to a value, and the value comes from one or more of four approaches. Across the 619 valuations, 40% gave weight to the market approach through guideline public comparables, 40% to the asset approach, 26% to the market approach through an OPM backsolve on the last priced round, and 7% to the income approach. The shares add to more than 100 because many reports blend two approaches.
Two of those numbers deserve a pause. The backsolve, which prices common stock from the terms of the most recent preferred round, is the method founders hear about most, yet only one valuation in four used it. A backsolve needs a recent, arm's-length priced round, and a company that raised on SAFEs or has not raised in a while does not have one. Our explainer on [how a 409A allocates value into a strike price](https://www.409.ai/articles/409a-allocation-methods-opm-pwerm-backsolve) sets out what each method needs.
The asset approach, used in two valuations in five, is the method of the earliest companies. It values the capital invested in the business, and the report's methodology section describes it as the approach typically used alongside the market approach for stage 1 and stage 2 companies. The income approach, a discounted cash flow, needs a credible forecast, and only 7% of valuations relied on one.
What a founder does with this
Take an illustrative company whose common stock is worth $1.00 a share before the discount. At the latest median of 42% the fair market value, and therefore the strike price, is $0.58. At the stage 1 median of 38% it is $0.62; at the stage 4 median of 46% it is $0.54. The eight cents between the stage extremes is the whole difference between a grant the team finds generous and one it finds ordinary, and it comes from the DLOM section of the report, not from the company's headline value.
So when the draft arrives, read that section before the summary page. Check which stage the report placed the company on and whether the description fits. Check the selected volatility, the time to the modelled liquidity event and the weights across the qualitative analysis and the two option models. Check which approaches carried the value and why. Our [section-by-section walkthrough of a 409A report](https://www.409.ai/articles/decoding-a-409a-valuation-report-walkthrough) shows where each of those lines sits. If a number does not match what the board knows about the company, say so while it is still a draft.
And keep the clock in mind. The safe-harbor presumption in [Treasury Regulation 1.409A-1(b)(5)(iv)(B)](https://www.law.cornell.edu/cfr/text/26/1.409A-1) holds for a valuation no more than twelve months old, and only while no later event has materially changed the company's value, so a priced round or a similar event ends it early; our guide to [when to update a 409A](https://www.409.ai/articles/409a-valuation-frequency-how-often-should-you-get-one) lists the triggers. A discount that was ordinary a year ago, at 48%, sits six points above today's median, which is one more reason a stale report costs more than its price tag suggests. The [409A valuation](https://www.409.ai/products/409a) from 409.AI prices every one of these lines in the open, with the stage, the volatility and the approach weights stated in the report, and a draft a founder can question before it is final.
How we measured
The population is every 409A valuation 409.AI published from April 2024 through September 30, 2026: 619 reports, the whole history, not one quarter. Each figure is a median or a share computed across that population, grouped by the quarter the report was published or by the AICPA stage the report assigned. The discount is the weighted DLOM each report applied to common stock; the volatility is the relevered blended equity volatility each report selected for its option models; an approach counts as used when the report gave it a weight above zero. Any group with fewer than 30 valuations is left out rather than shown, which is why stage 3 is missing from two charts. Percentages are rounded to the nearest point. The data was read on October 22, 2026, and the series behind each chart, with its query and group sizes, is kept with the article's source file.